Calling the bottom, the European CRE cycle is turning!
The European CRE markets have bottomed. Cap rates have stabilised, and solid operating fundamentals have kept rents ticking up despite a slowdown in the economy. CRE market indices and REIT indices have already begun to rebound, some big deals are hitting the headlines and transaction flows are picking up, and it seems highly likely that a new cycle is starting.
Chart 1 – CRE Prices
This is no great surprise. After a big correction in response to rates spiking dramatically in 2022 and a near complete cessation of deal activity, the prospect of rates being cut and curve normalisation was always likely to be a catalyst for flows. The turning point is now clearly visible in the key leading indicators, which have been ticking up now since the first quarter of 2024.
Chart 2 – European CRE Sentiment Indicator (INREV)
The European CRE market opportunity is significant!
In practice, turning points after big corrections always bring significant opportunities for investors. Over the past 50 years an investor buying in at the bottom of a CRE cycle has been handsomely rewarded on a risk adjusted basis.
As the chart below shows – buying ‘low’ (post correction) and riding the upswing has been extremely lucrative over a 5 year time horizon. Historically core unlevered returns on prime CRE assets have consistently exceeded 10% on a 5-year average basis. This level of return with limited downside risk is hard to ignore.
Chart 3 – CRE Returns for Prime Property over Cycles
Based on CBRE Prime Property Indices - calcs from Tristan.
Getting invested has to be the greatest priority for LPs!
Right now, we see some interesting pathways to exploiting the cyclical opportunity across the capital stack with excellent risk adjusted returns on offer across a wide range of credit and equity strategies.
We spent a lot of time over the last 2 years laying out our views on the credit opportunity – we believe it remains an 8-10% returning opportunity (net). Given the returns (which are outsized for CRE credit on an historic basis) and the secular shifts going on in the sector (that will allow non-bank investors to build scale quickly), credit is one of our highest conviction CRE investment themes.
That said, with the cycle now turning the opportunity to earn 10%-20% returns in the equity space is back at front of mind again. As with any new cycle, the equity opportunity will range across the risk spectrum all the way from core to opportunistic. Big cycles always create dislocation, distress and opportunistic investors with lots of risk tolerance are always well positioned to gain immediate and substantial upside benefit, but equally there can also be some interesting (and often overlooked) opportunities for investors with less risk tolerance. One such opportunity is clearly visible right now in core and core+ CRE funds.
Current Core+ opportunities!
Clearly given the equity returns on offer (assuming a normal recovery cycle), being able to buy straight into an existing low risk CRE fund looks compelling. Most specifically, there are a number of high-quality Core and Core+ funds that have exit queues where secondary trades are still possible at modest discounts to net asset value. If you can access a fund with a NAV that fully reflects market prices and there is a small (because NAV is reliable) but meaningful (say 5%) discount, then this is a major opportunity to buy the bottom at a discount to NAV and to get fully allocated or, indeed, to leg-in/cost-average into the opportunity over a couple of quarters.
Points to note before you pull the trigger!
It goes without saying that choice of fund manager, asset base and investment style matters massively when it comes to making an allocation decision. In our view, the best Fund's are always aggressively repositioning into assets and sectors that will maximise the benefits of any upswing and their teams are sweating every asset to maximise operating cashflows to boost performance as the cycle accelerates. We suggest that this best achieved by taking a more active approach, typified in a Core+ style. By the same token, our experience over prior cycles suggests taking some measured Core+ risk at the inception of a cycle tends to pay exceptionally well, as many investors carry their prior cycle PTSD over into the recovery and fail to focus fully on the forward-looking opportunities that arise as the market recovers.
The determination of a rebased NAV is clearly also critical in the execution of any opportunity. Funds that are still focussed on yesterday’s NAV may not be alive to tomorrow’s opportunity and they may struggle to position for it. NAV should be clear and easy to test. In our view a core or core+ fund NAV needs to have been produced consistent with INREV guidelines, with an external appraised independent valuation that would stand the test of audit scrutiny. An NAV should be produced quarterly – not just when it suits the manager. An NAV should reflect market prices and this should be tested with sales and acquisitions. Investors that are thinking about allocating capital need to scrutinise NAV’s so that they can have confidence that their basis is robust, the manager is focussed on the future and thus that their capital is going to be invested wisely to capture the cyclical upside.
The CRE industry is at best inconsistent when it comes to the statement of NAVs. As the chart below from Bloomberg illustrates, some managers have clung onto historic book values that fail to reflect the reality of current market prices. We might want to call them ‘flat-liners’.
Chart 4 – Property Fund NAV’s vs REIT stocks
Flat-lining funds are not solely the preserve of obscure managers. Some very large private markets firms, that should know better, are in this sample. The impacts can be simply summarised:
• Funds who have taken their marks will get the benefit of the cyclical upswing ... but people in the funds with NAVs that have ‘flat-lined’ since 2021 will not so their performance will also be flat going forward. The time weighted effects will begin to bite, so ‘flat-liners’ will underperform on the most relevant relative metrics into a recovery.
• Funds who have taken their marks will receive inflows and may make new investments at better prices and are then also able to reposition more aggressively for new sources of growth ... so their upside can be maximised. ‘Flat-liners will be trapped in yesterday’s portfolios limited flexibility, so their performance will take a further hit.
• Funds who have taken their marks will be able to trade assets at NAV or better and thus offer clear price discovery. This will allow them to raise new capital that should allow them to demonstrate how they will be able to provide liquidity to their existing investors over time, while still growing and adapting their portfolio. LP’s with capital in 'flat-liners' may find that liquidity will be limited and they will be forced to sell high quality assets and shrink their portfolios.
None of this is new news … it happens in every cycle. It creates a distinctive pattern of winners and losers in every recovery cycle. The managers that do the right thing thrive. For most of 2023 people were using the phrase ‘survive til 25’ as a way to paraphrase their approach … well ‘25’ is now less than 4 months away and surviving a down-cycle doesn’t guarantee outperformance on the way up… its time to think forward.
So what?
There is a clear message here. The market is turning. There are significant credit and equity opportunities for CRE investors. Some groundwork is needed to exploit the window of opportunity but that’s no great surprise for CRE veterans. And as we have learnt time and again in prior cycles, waiting for the all-clear to start that work means missing out on the best opportunities. Now is the time to act.
Turning points, normalisation & recovery...
Last Thursday afternoon, the ECB made history. For the first time since its foundation, the European Central Bank cut rates before the US Federal Reserve. This marks a welcome turning point in the interest rate cycle after a period of significant turmoil and uncertainty. It marks the start of the process of 'normalization'.
Rate turning points, like these, are of significant importance to investors in leveraged asset classes like ours. Typically, rate cuts are the first step in normalizing an inverted yield curve, and as inverted curves cut the supply of credit, the cut is also an opening salvo in the process of normalizing yield curves and credit supply. As credit cycles and CRE cycles are closely interwoven, big turning points in credit almost always catalyze turning points in the CRE cycle. So now is probably a good time to spill some ink on what we should expect as the rate, credit, and CRE markets start the process of recovery and a new cycle begins.
The first point to make is that new CRE cycles are not always made equal - they vary in tempo and scale. In our view, the best way to understand whether you are looking at a major turning point is to start by looking at the historic data on price indices. It doesn't take long to figure out that a full reset has, in the past, required a correction that reduces values by more than 20% in GAV terms (and that systemic +40% GFC event is an oddity given Q4 2008 and Q1 2009 accounted for almost half of the 43% correction that occurred). Put more simply, a GAV fall of 20% is more than enough to call a cyclical reset and the market dynamics that disproportionately favor people with capital over people who need it.
We like to fine-tune this heuristic by looking at price data in real terms and relative to trend over time, as shown in the charts below. You can look at it in nominal terms and un-trended, but we think our approach helps because it seems to be better as a tool to help us understand the underlying dynamics of each cycle.
Our approach identifies three prior 'Big-C' cycles - S&L crisis (1992), 9-11/tech-crash (2001), and GFC (2008) and it is immediately clear that these cycles have somewhat different dynamics. We can see in the charts below that the 2001 and 2009 recoveries in performance appeared almost immediately after the market bottomed, creating a visible capital value bounce. In 1993, the market correction completed, but the bounce was very limited out, and the market picked up slowly. A full recovery in performance really only started to accelerate in mid-1996 when real capital values began to tick up.
The difference in the pace and acceleration of these recoveries is, in our opinion, largely a function of the speed and scale of the policy response that came out of the central banking system in each case. In 2001 and again in 2009, rates were cut dramatically, and the system was rapidly flushed full of liquidity as inflation was collapsing. This wasn't curve normalization - these were emergency deflation abatement measures. They were an overwhelming show of force, and unsurprisingly the CRE market bounced back immediately, led by levered investors and cap rate compression.
The 1993/94 monetary policy cycle was different from the 2001 and 2009 inflection points. Bond yields initially collapsed when investors perceived recession risk in 1992/93 but yields stepped back up as investors were kept on their toes by surprisingly robust GDP growth and CPI volatility. The volatility subsided in 1995 and 1996 and the yield curve normalized and this was the catalyst for recovery in transactions and deal flows. However, normalization involved relatively modest moves in rates (and spreads between rates and CRE yields remained relatively thin) so while flows picked up, the cycle meandered. Capital value growth accelerated only when it became fully apparent that nominal growth was feeding into operating cashflows at the asset level. Rising rents drove a real recovery in investor returns, not levered yield compression. Levered investors focussed almost all of their attention on operating company investments, capex and development plays and sought out distress. Does any of this sound vaguely analogous?
To be honest, if you ignore all of this and simply focus on how important rental growth has been since 2023 (as the chart below shows), you probably have most of the information you need to estimate what will drive this recovery. In a higher cost of capital world, cash flow is king... just remember that cash flow-driven recoveries tend to build slowly at first, particularly when people are worried about CPI and the volatility of rates.
Those of us who were around in the 1990s will remember what this type of investing looks and feels like, and that, in practice, this does tend to favor people who know what they are doing when it comes to driving operating income at the underlying asset itself. For some, that will sound like (and can be) quite hard work, but it comes off the back of a big price correction, so people who make the right plays are going to get well paid for the effort.
We will come back to some potential 'plays' into this type of recovery in a second. First, we need to cover a bit more detail on timing and how the cyclical pathway impacts returns. The two charts on cycles show you broadly how timing the turning points has worked in prior cycles. As we have already noted, a significant divergence below the long-run real trend is usually a pretty reliable indicator of the bottom. If we take 'max divergence' as a reference point, adjust for the credit lag to estimate a start point for 'recovery' and do some simple math to calculate the total return on offer over the subsequent 5-year period, we can approximate the turning point effect (shown below) on returns.
As we can see, getting allocated close to the turning point in the market cycle when values have fallen below their real trend is almost always double-digit accretive for investors on a forward-looking basis. Note that this data is for core unlevered CRE based on the capital value indices produced by CBRE (and that unlevered returns in a diverse portfolio will typically be a couple of hundred bps lower).
So what are the immediate actionable implications of this analysis? If the analysis is correct and this is a double-digit return opportunity, and this new cycle starts with a 90's style phase of slow and steady recovery, there is an opportunity to do two (or three!) things now:
CRE Credit - The first, given a high nominal 3-month rate and Europe's floating rate lending approach, is to scale up private CRE credit exposure. Ultimately, credit will continue to do well in a rate environment that normalizes slowly, with an obvious bias to investing more while the curve is inverted/flat over the next 12 months. In practice, although a slow transition to a normalized rate environment will provide some relief to borrowers and banks, the more modest pace of capital growth and massive step up we have seen since in credit costs since 2021 will mean that borrowers will have to keep working hard to find alternative sources of credit to complete their refis. In practice, this will mean the cyclical demand for private CRE credit will continue to be high, and we think demand is likely to outrun supply in for several years to come. Our conviction around this scale-up opportunity is reinforced by clear structural change. Europe's adoption of the final layer of Basel 3 regs comes into force in January 2025. This final step (now known as Basel 3 end-game) will, in turn, tighten the rules on how CRE bank loans are rated and classified and make it significantly more expensive for banks to refi loan exposures with lots of capex, high LTVs, and low DSCRs. Evidence from markets where elements of this regime are already in place suggests regulated balance sheet lenders will permanently retreat to the safety of very low LTV lending on stabilized core assets and senior credit line lending to funds under these conditions. This leaves a yawning gap that private lenders will need to fill.
CRE Equity - The second opportunity is to start to leg into the equity. As stated we would expect that this will be a double-digit returning strategy on the basis of a typical cyclical upswing. Again, in a slow-burn upswing, the returns could remain rich for some time. However, experience suggests that it is always worth looking around to see where there might be immediate opportunities to take advantage of capital constraints to boost returns. We think this is visible in two places today:
We would look closely at core/core+ fund redemption queues to see if there are any immediate opportunities to pick up secondaries in high-quality funds. On a scaled basis, it may well be possible to buy into a good quality, well-managed, externally valued core/core+ fund off Q1/Q2 NAVs at 5-10% discounts. If this is the case, then we think it’s worth picking up the pen. If you can get a look through to the underlying CRE, have trust in the manager, are getting invested alongside institutional quality LP names and the NAV is independently verified, then, in our humble opinion, this is an immediate actionable opportunity.
Additionally, we'd look at opportunities to take advantage of special situations that occur as a result of refi pressures, recap needs, and idiosyncratic distress via the opportunistic equity funds. Everyone with risk-tolerant capital loves a motivated seller, a distressed creditor, or a developer struggling with a wobbly funding model. Given the scale of the correction we have seen in the capital markets and the challenges associated with a stepped-up rate environment, we think there is a clear window for opportunistic deployment as capital remains very scarce and hard to aggregate. Truly opportunistic windows don't last forever, because flows always come back. But if we do bump along the bottom in 90's style for a couple of years, there will be more than one mid-teens vintage.
When combined together, we would suggest that this debt and equity combination sets up an interesting 'barbell' for CRE positioning over the next few years. On one end, you may be able to print 8%+ coupons from relatively conservatively positioned whole loans secured on high-quality CRE, and on the other, you could very well be making 10%+ net on CRE on an unlevered basis with some upside optionality as the cycle picks up pace ... which you can build out quickly by hoovering up core/core+ secondaries (at a discount) and at the same cherry-pick capital-constrained sellers and special situations via opportunistic allocations. This is a full agenda for the next couple of years, but this is the life of people that invest in cyclical asset classes!
The last page turn in the playbook is positioning within the portfolio. This is particularly important today as we are in the midst of some pretty profound thematic shifts in the CRE market, centered around sector-specific secular trends. We suggest this is where you need think about a somewhat reworked playbook. Today's winning themes are not that likely to be the same as those that worked in the1990s. Even dinosaurs like me recognize it!
In our view, this is now largely about making sure you are allocating to sectors where nominal cashflows are likely to grow fastest (specifically secular tailwind-oriented themes where demand outruns supply and vacancy remains low) and to sectors where investors are willing to acknowledge that this cashflow growth is long term sustainable (i.e., investors are not worried about secular headwinds and idiosyncratic obsolescence risk). The harsh reality is that the playing a slow burn recovery in a stepped up rate environment may be a 'k-shaped' opportunity.
Please shout if you'd like to discuss any of these thematic upside ideas in more detail - we've done a lot of thinking about the the cycle, the changing nature of our market and how best to deploy capital in this ever-evolving world. Timing remans as important as ever, but we think the changes in portfolio structure that we will see in our clients portfolios are also really quite profound. Equally, as you know, I am always willing to elaborate!
Let’s talk about the reality of 'soft-landings'…
This section of text - abstracted from Bloomberg yesterday - came at just the right moment. Despite manny people continuing to espouse the consensus view that an economic ‘soft-landing’ is on its way, over the last few weeks we have had a lot of inbound questions from clients concerned with the risks around ‘recession’. These calls have become more frequent in light of the clear slowdown now visible in Germany and the UK economies.
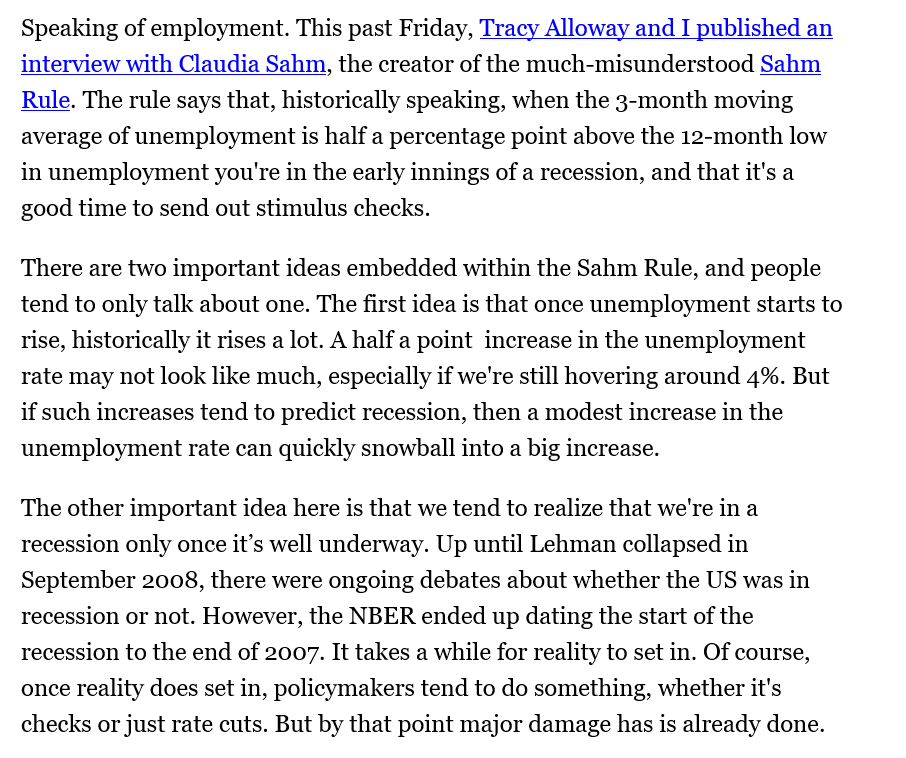
When most people talk about recession - they think of earnings or GDP. Maybe it's because we spend alot of time talking to US clients or perhaps it's something to do with being in real estate, but for us (like the authors here) divining a 'recession' is not really about GDP growth rates or earnings cycles - it's really about jobs.
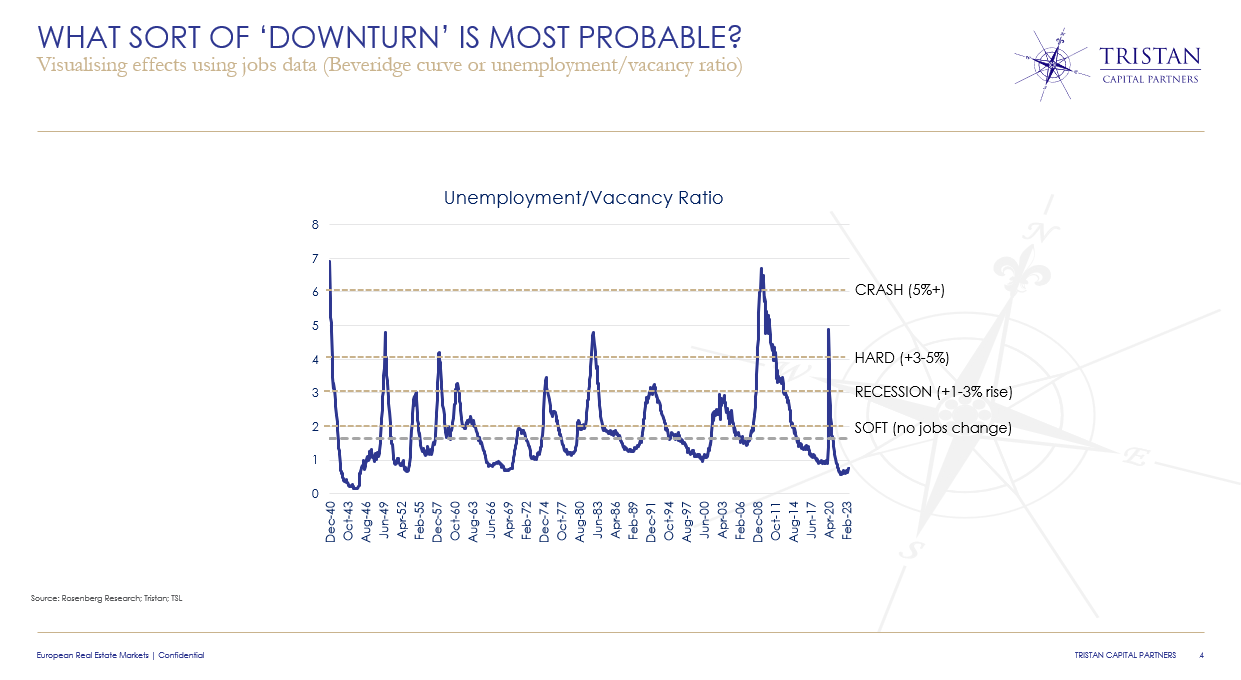
There are lots of rules, models and curves when it comes to measuring jobs and recessions (Sahm, Beveridge, etc) - but we think one of the best ways to look the impact of employment is by comparing the unemployment rate with the job vacancy rate as a ratio ... as we show here below ...
This chart shows you just how difficult it is for central banks to control the effects of tightening cycles - as the passage from Bloomberg says:
'once unemployment starts to rise it rises by a lot...'
In the case of our 'ratio' this 'step shift' is very clear because rising unemployment and falling vacancies are concurrent and this magnifies the 'signalling' effect. Nevertheless, it makes for a great indicator and it also gives you a real sense of what people mean when they use phrases like 'hard-landing' or, for that matter 'soft-landing'.
Ultimately - we believe this shows is that there are actually 4 ‘states’ of ‘recession’ - and reaching them in turn depends on the policy errors/risks of financial accidents and contemporaneous feedback loops that exist in our complex financial and economic eco system. In basic terms you have:
- 'soft-landing' - slower growth but no significant jobs impact
- ‘normal-recession' - a garden variety slowdown with a 1-3% loss of jobs
- 'hard-landing - a significant downturn with 3-5% job loss
- 'crash-landing - a serious deflationary downturn with 5%+ job loss
So what does this mean for the current cycle?
So here is the tough piece - the landing zone for a 'soft' touchdown is in practice quite small ... and while it is not impossible to achieve, it just doesn't happen very often. John Auther’s put it quite nicely in this excerpt below:
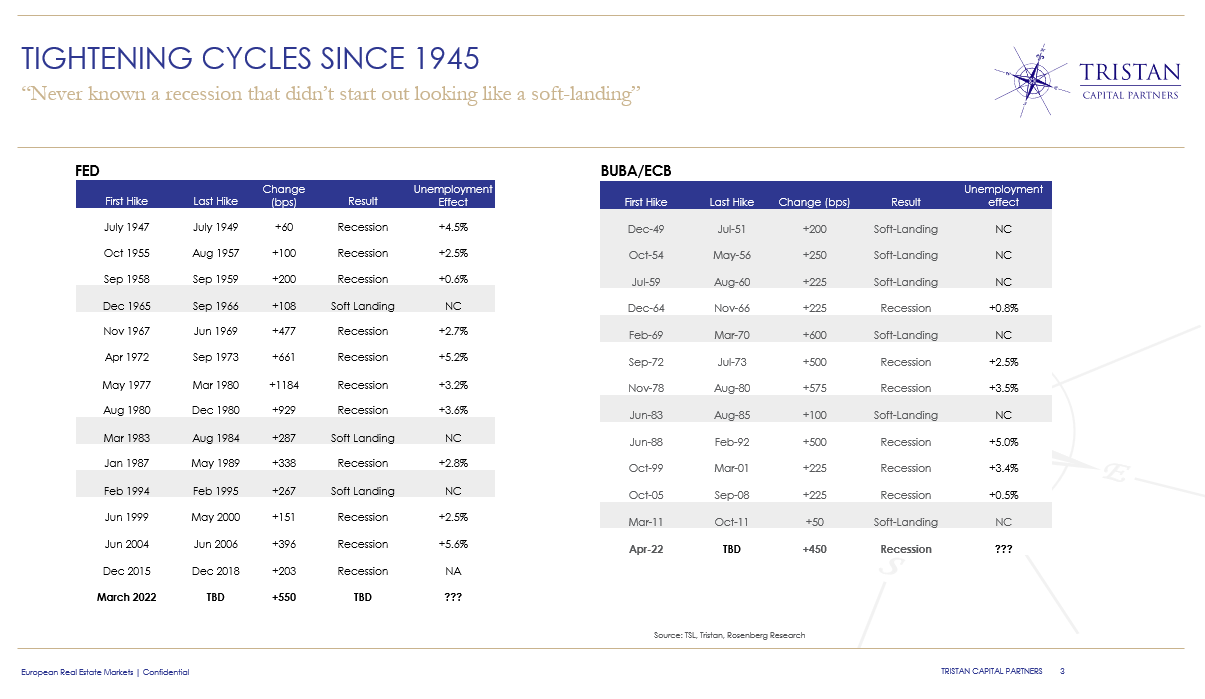
Equally as the table below the probability of a ‘soft outcome’ even lower when the tightening cycle comes quickly and in scale. Large, rapidly redeployed tightening cycles don't tend to be suited to 'soft-landings'.
In fact - the only soft landings we have seen (at least using our definition) in modern economic history have only happened when the Fed tightened - broke something in the financial system - and then quickly eased off before the prior tightening had shifted the needle on jobs. The problems with these 'soft-landings' is that within 12 to 24 months the Fed is then tightening again. IMHO this is the genesis of the discussion of ‘higher for longer’. It seems to us that if the policy concern is inflation volatility and wage pressure via a tight labour market, and the solution is tight monetary policy, then a recession avoided is simply a recession delayed. The odd’s are stacked against the consensus, as Greg Ip recently put it in the WSJ - "every recession starts out looking like a soft landing... ".
To that end - a ‘normal’ recession now is, ironically, probably a good thing - next step if for the central banks to time its easing in response to a weakening labour market to ensure that recession is not morphed into ‘hard-landing’. As CPI is moderating and weakening the job market seems to be slowing (particularly in Europe), we have no reason to expect anything worse ... or indeed better.
Who knows ... maybe a soft-landing is a shoe-in and the probabilities (as defined by 70 years of history) could be proven wrong ... maybe demographics have changed the calculus in labour markets …geopolitics could certainly toss us a curve ball … we know from past experience that nothing is truly certain or completely assured.
My personal view is that given the scale and speed of the tightening it will be very challenging to land in the ‘soft zone’, particularly in Europe. Stopping an economy on a sixpence is hard when you go from gunning the accelerator to slamming on the brakes, particularly in wet weather.
Latest research from the guru of WFH ...
Nick Bloom was catapulted to (research) fame when lockdown hit ... I first came across his work in early 2020 when we were all frantically scrambling for some analysis that would give us a sense of what impact remote working might have and found the report he co-authored in 2015 that examined a case study experiment in China.
He continues to provide some awesome insights on how WFH is evolving and is now one of the most frequently cited academics in the field of econ. Our CEO, Ian Laming, passed me a copy of a report that he had received from the UK IFS - they've kindly allow us to share that piece with you ... please enjoy!
Great piece of (late) analysis on inflation ...
I feel a little sorry for the people who write these research papers. They have worked tremendously hard over many months to produce excellent analysis on the nature of inflation and how to think about it, and then they publish their work just at the point when the focus of the world's attention has pivoted to the disinflationary impacts of a dislocation in the US regional banking system.
To be honest, late or not, the work is worth a read. It's never inappropriate to think about inflation risk... because major inflation surprises, however improbable, tend to have wide ranging consequences for the way investors allocate capital.
These inflation notes have been penned by the BIS and economists at UMass Amherst. They are definitely up there in terms of quant/nerd factor, but the narrative around the quants/data is, IMHO, really quite interesting particularly in the 'sellers inflation' piece. The papers are linked here:
My interpretation of what I read is that inflation 'shocks' are typically initiated by a wider (unexpected) geopolitical or commodity price shock - they percolate through margins into prices and ultimately reach wages where the net impact depends on labour capacity. A single shock on its own might cause a one off adjustment in the price level and change future wage growth expectations marginally, particularly without an appropriate policy response, but several shocks 'daisy-chaining' together over a period of years (as they did on a grand scale in the 1970s) can outrun monetary policy and this may cause wage and price inflation to become more persistent . This is the 'regime change' that the BIS identify. When this happens monetary policy and markets can get pretty 'wild' (I guess this why so many are now convinced that Powell is Volcker reincarnated - BTW as an econ historian I am a big fan of PV - all 6'7 of him - met him once and have an accompanying story).
In Europe, after such a long period of very low inflation and zero rates, these risks and uncertainties weigh somewhat heavily (as the FT pointed out yesterday), but the different trades offs that inflation risks present us with are clearly at the centre of why investors are still allocating capital to the sector. Yes the market is levered and yield spreads to rates and fixed income might be tight today, but leverage is no where near where it was last time around and if the economy slows the spread might be wider tomorrow. Equally if rates stay elevated the appeal of stable indexing cashflows remains. As we said in a research piece in 2017, our sector is rate sensitive and leverage risk needs to be carefully controlled, but the asset class is also has some inflation optionality. Investors that steer their capital into the right parts of the market (those parts where long term pricing power is strong) and take the right risks should be able to benefit from the optionality and sleep more comfortably at night.
I will leave you in peace to read these wonderful tomes and ponder the ideas at your leisure. As always if you want to discuss inflation, disinflation, credit and asset allocations in more depth please reach out - I am always up for a chat!
Simon Martin
WSJ on offices ...
This WSJ article is a balanced perspective on what the key differences are between European office markets and what is currently going on in the US ...
It mirrors our views on the sector ... and is well worth reading ... happy to bore people to sleep with the detail and how energy efficiency plays into these trends if you want to discuss!!
And giving ...
A couple of clients reached out last week after my last outlook file drop - they were wondering if I could summarise the various outlooks I made available to you all ...
I respectfully said that Tristan's (modestly staffed) research team would struggle to cover it all this side of Easter and that, in any case, we couldn't really compete with Bloomberg's army of analysts (and AI bots??) ...
This is the definitive summariser...
BTW if this was done by real people it is a tremendous effort ... a thing of wonder!
Simon
The research gift that keeps giving...
Happy New Year ... normal service resumes!
So, every year as an annual ritual I spend some time reviewing the plethora of bank, asset management and adviser 'Year-End Outlooks' that pour forth from our friends, partners and competitors across the investment industry.
This requires visiting all manner of investment websites and it struck me this year that it might be useful to save you all some pain and so I have taken the (diabolical) liberty of consolidating the documents we have collected in one place so that you can view them at your leisure (if that's what rings your bell...)
There are 25 books from a range of sources and I can't profess to have read every page in every book or to have critically assessed all of the different perspectives ... but there are some interesting views, great ideas and some excellent charts. Overall my sense is that the economics community is a little bit too optimistic about the path of growth for this year ... and that the landing we are about to experience is not going to be as 'soft' as they would have us believe.
I hope you enjoy the books and we look forward to catching up with you soon to debate what it means for real estate markets and investment strategy in 2023!
KR - Simon
The Reality Check - the whiff of recession brings with it a change in risk appetite and an opportunity...
The statement that real estate investing is all about ‘credit and cranes’ feels like an over-simplification, but the reality is that ... for the most part ... it’s as true today as it has ever been.
How should we think about ‘credit’ given the inflation uncertainty we are faced with?
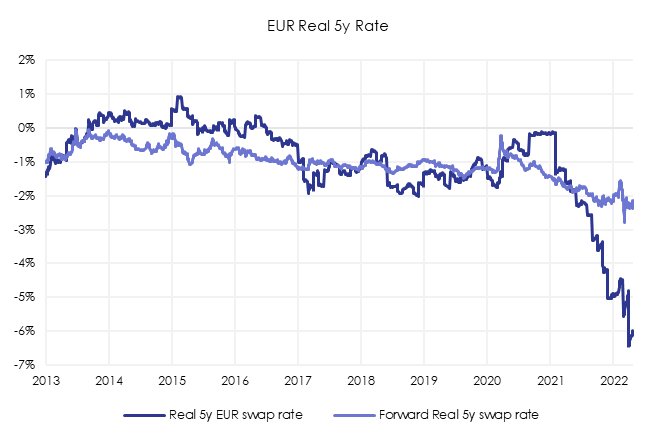
Ultimately when we reference credit what we are really saying is that we believe that real estate markets work well when credit conditions are accommodative. Our view of credit conditions is largely determined by the level and stability of real rates. Real interest rates are important because they determine how capital gets allocated. Negative real rates encourage people to invest capital and tend to boost and support GDP growth. Positive real rates encourage people to store capital and slows growth. The choice of a negative or positive real rate inflation is largely driven by inflation risk. Central banks worried about inflation tend to push for a positive real rate seeking to slow the economy, central banks worried about deflation choose a negative real rate.
Chart 1 – Real Rate Outlook in Europe
Ideally real rates should hover around zero with a slight negative (pro-growth) bias to maintain high levels of employment and stable incomes. Rate stability is viewed as particularly important as capital markets are alert to the risk of instability, largely as this raises the risk of central bank policy error as this has, in the past, triggered recessions. Selfishly, a negative (but stable) real rate environment also represents something of a goldilocks environment for real estate investors, as it creates a positive economic tailwind behind leasing, drives allocations in our direction (from bonds) and allows us to safely make use of moderate leverage, which is highly accretive.
Ultimately part of the challenge we face right now is that the current spot (trailing 12-month, quarterly and monthly) CPI has become unstable. Real rates as measured by the different measures of spot CPI have thus become hard to predict. Coupled with this, the popular measures of spot CPI and the market implied levels of long-term inflation expectations have diverged. The data are sending us mixed messages and capital markets are therefore on alert for a policy mistake, fearing an ‘over-tightening’.
The reality is that the answer to the inflation conundrum is partly about looking past the spot metrics and paying more attention to medium term expectations (which are more stable as shown in Chart 1) and partly about refocussing on the effects of rising prices on real incomes and wages. Across a broad range of European countries there are signs that the sudden and unexpected rise in commodity prices associated with the Russian invasion of Ukraine is squeezing real incomes. Wage growth is not offsetting this effect and that this in turn is slowing down economic activity.
Chart 2 – Economic Outlook
The major sentiment and economic leading indicators have all rolled over and we are already seeing some flash GDP data suggesting that Q1 2022 saw the economy flatline. The educated narrative in the economics community has already begun to pivot from a discussion of the risk of policy error to the discussion of different soft-landing scenarios. There is a distinct whiff of recession in the air. If this is the case then investors should look at long term implied inflation expectations to understand real rates, not spot CPI.
In Europe, the discussion of recession risk is starting even before the central bank has begun the tightening cycle. Whatever the narrative, it now seems as if energy price inflation has done some of Madame Lagarde’s job for her. If the current energy price hikes are, as we expect, worth the equivalent of 100-200bps of monetary tightening in Europe, given a steeper EU yield curve and a tightening of credit conditions as economic growth slows, Madame Lagarde may be about to do a ‘Trichet’ and complete a full monetary policy cycle without noticeably raising short term rates. We may not be at the end of the tightening cycle yet, but the implication is that the risk of European policy error may be reducing. Under these conditions the path of real rates will not change substantially. Yield curves may flatten and the probability of inversion rises. Real rates would thus remain negative. This would allow investors to focus on the business of allocating capital.
How should we think about ‘cranes’ given the outlook for the economy?
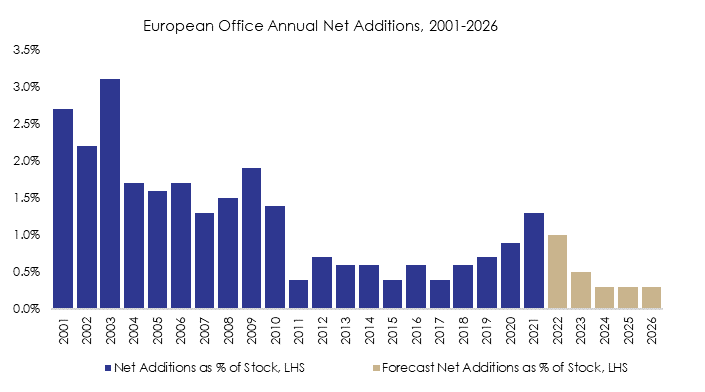
In practice, when the risk to rates subsides, most risk tolerant investors will quickly turn their attention to the opportunities that a slowdown in the economy might offer. Coming, as it does, at a point where there has been very little construction for 3 years and grade A vacancy is sub 3%, the discussion of ‘how cranes impact our sector’ will resume.
Chart 3 – Vacancy & Construction Costs
The dearth of new construction can largely be attributed to the lingering effects of covid. The pandemic disrupted existing construction works and caused many developers to delay construction starts. Now the construction cost inflation we are experiencing is making it harder to justify new building until rents go up, further slowing the pace of activity. Low vacancy will therefore persist and the challenge of developing will not get any easier if economic uncertainty impacts financing markets and risk appetite over the coming 12 months. The prospect of a sudden surge in new supply looks very remote. Development is an inelastic business, so parts of the real estate market could remain acutely supply constrained for several years, certainly over the next 2 years.
Chart 4 – New Development Activity
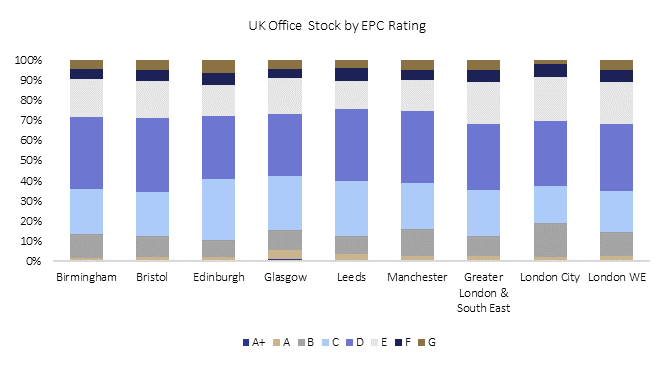
Short-term supply chain, cost and financing issues may be further exacerbated by tenant needs centred around ESG. We have written extensively about our views on the way in which ESG is accelerating change in our market. The energy efficiency requirements being stipulated by our tenants are narrowing the range of buildings that corporates consider to be acceptable for long term occupation across all sectors and property types. This shift is now being reinforced by regulations that will begin to limit landlord ability to lease buildings with poor energy efficiency ratings.
Chart 5 – ESG Factors
This ESG ‘shock’ is a disruptive change that will reduce the inventory that is available to tenants. In our humble opinion, it has the potential to be every bit as impactful across sector as the impact of ecommerce was for retail assets. What is notable right now is that it is funnelling demand into a relatively small inventory of highly amenitised appropriately accredited buildings when, in true real estate style, the supply of these buildings is at an historic low, particularly in high knowledge cities. Rents will (and are already) going up for these assets. It will not be long before investors begin to differentiate these assets and prices adjust accordingly. Thoughtful investors have been adapting for this environment for some time and this ESG paradigm will remain firmly at the centre of the way we design our strategies and invest capital.
How best to adapt strategically in this changing environment?
The combined effects of post-covid recovery, geopolitics, a climate crisis and ‘tech disruption’ makes it very challenging for investors to control risk. Markets continue to evolve and change rapidly and the outlook continues to be volatile and uncertain. Investors in our asset class in this environment need a clear top-down vision of what makes sense and the ability and platform to get allocated to the right strategy quickly. At the same time they need the discipline, vision and entrepreneurial instincts that will allow them to pivot, adapt and reallocate. Likewise, as the delta between winning assets and loosing assets will be significant, investors will also need the bottom up asset management acumen and reach required to manage the challenges associated with ever changing tenant needs in a broad range of different geographies and across sectors.
Some investors will find this complexity all too much and a few will panic and sell up, but this should be an environment where managers with the requisite skills, platforms and vision to build conviction and execute on their ideas can make profits for their clients. We expect that better equipped investors will stay the course, and those that are well equipped will rub their hands and double down.
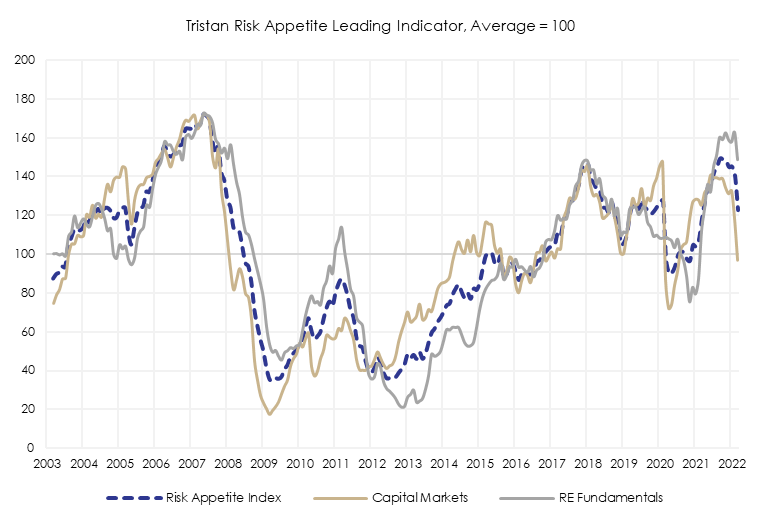
Equally, right now, with the economy slowing and risk appetite reducing, we believe the window to take advantage of this opportunity may be opening. As we have discussed we see strong evidence suggesting that economic growth is rolling over and we expect credit is will become harder to find, particularly for risk assets. Our risk appetite leading indicators suggest that the competitive landscape is shifting in our favour.
Chart 6 – Tristan Risk Appetite Index
These windows don’t come along often and they don't remain open for long. History tells us that the RE investors that accelerate deployment into these windows tend to consistently outperform.
The Reality Check... short(ish) comment on inflation...
The horrific situation in the Ukraine has prompted a lot of inbound calls on the subject of inflation, inflation hedging and real estate. I have a history of publishing premature inflation hedging advice so I will resist the temptation to pour out my heart ... please see earlier threads on this subject on this site ... or reach for Jim Reid (vintage 2018)...
The point of this note is not to boost Jim Reid's reputation for foresight (he already has plenty of fans and followers - moi included) or our past perspective ... but rather to highlight some analysis produced by our advisers TSL that is spot on. They make the following interesting points:
1 - 1970s inflation spike flowed from the one-off devaluation of the US$ in 1971 - the US$ deval (of 20%) repriced the entire commodities complex overnight and, as it represented a reference currency devaluation, it was quickly recognised as a permanent change in the price level. It also undermined the world's faith in the reference currency that had additional geopolitical consequences (which rumbled on for nearly a decade).
2 - At the time the US Fed (and the other major central banks) couldn't decide whether it made sense to increase aggregate demand to lessen the real impact of energy prices rise (i.e. boost incomes) or to tighten policy modestly and allow energy price inflation to slow the economy naturally. They vacillated and the net effect (given the boomer demographics below) was a boom that boosted real incomes and validated the price effect - this went straight into wage growth. Without the anchor of gold, this further destabilised the US$. The rest, as they say is history.
3 - The inflation effect persisted for nearly a decade - until Mr. Volcker choked it off by jacking real rates in 1981 and, most importantly, re-established the concept of central bank credibility.
The UK went through all of this ... but on steroids .... the UK currency was already struggling after multiple devals in the 1960s and the UK validated prices in the 'Barber boom' in 1972 - that in turn led to an even bigger set of problems in the mid/late 1970s. That said the UK then is not the UK now and as someone that actually remembers the 1970s ... I think this FT/JP Morgan headline is a little rich...
BTW - the bible for what this looked like in the UK RE market is Peter Scott's book - 'The Property Masters'.
The point is that for people that are really thinking about inflation - understanding the cause/effect is important, as is the subsequent policy approach to any shock. Simply screaming 'stagflation' and then heading for the hills is not an effective response. The lessons of the 70's suggest that in the event of a 'one-off' shock to prices than threatens to unanchor inflation, then policy makers have to quickly affirm a 'tightening bias', drain the punchbowl and allow inflation to squeeze real incomes... it might seem harsh but it is better than reprising the Volcker Fed!
The tightening bias has been affirmed and the punchbowl is already being emptied. Real incomes will therefore feel the squeeze. The question for investors then becomes around managing the risks of being wrong ... if you are worried ... then remember that typically people cluster around real assets ... because stocks/bonds don't hedge the risk...
I am travelling to the West Coast next week to see clients and for my first proper conference in 3 years! And as ever available for calls...
Simon