The Reality Check … Inflation Surprises Inbound?
The spectre of inflation has returned. US CPI came in last week at 5%. German CPI hit a 29-year high in September. Right now, we don’t quite know what the future holds but the debate on whether rising prices are transitory or persistent, secular or cyclical is heating up. So is the inflation hedging debate.
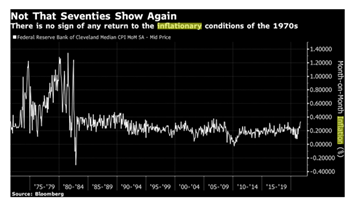
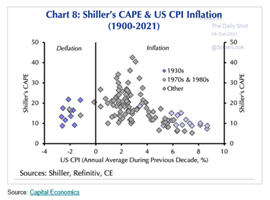
Headlines aside, there is no need to panic just yet. As this chart from the ever-excellent John Authers’ Bloomberg blog shows, we are still some way from a return to the 1970s. The consensus expectation is that inflation pressures are higher than they have been for some time but that they are transitory, thus the risks to long term expectations are low and stagflation is not seen as being a threat.
Even so, when it comes to portfolio decisions, ultimately what most investors really care about is the risk that the consensus is wrong. This is largely about surprises and the risk of central bank errors. A surprise that makes it hard to predict prices and causes inflation expectations to become unanchored is ‘bad’, not least because it makes central bankers very likely to err and raises the risk of ‘stagflation’.
That said, it is difficult to precisely delineate ‘unanchored’ or determine a bad inflation ‘event horizon’. The data suggests that the probability of bad surprises increases significantly if CPI exceeds 4% and remains anchored at the level for more than 12 months.
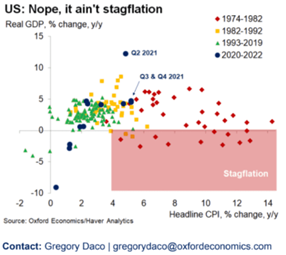
As this Oxford Economics charts shows, although we are passing 4%, stagflation is not an issue today. However, as the four charts below from Oxford Economics, Capital Economics and BAML show, the performance and diversification effects of inflation risk passing 4% and persisting at this level, can be very significant at the portfolio level. The Bloomberg headline on '60/40 portfolios' may have dramatized the situation, but investors are highly sensitive to the risk of high inflation and thus, at current CPI levels, given the risk they are still likely to contemplate an allocation response.
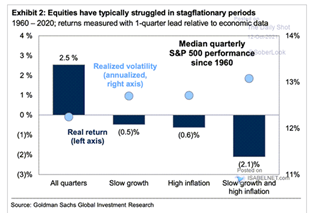

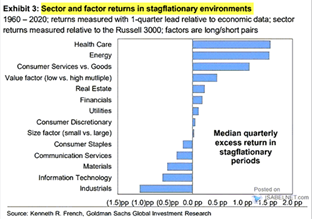
One of the most common moves is to play defence and bond investors typically advocate adding index-linked exposure and adapting the duration and risk profile of a bond portfolio. Equally, as this Goldman Sachs chart amply illustrates, stock investors have playbook and any are already beginning to consider rotating equity portfolio allocations towards sectors and companies that are perceived to have ‘pricing power’.
Even so many allocators will also go the extra mile and begin to look to alternatives that add both inflation correlation and additional diversification to their allocations. Alternatives, real assets and real estate will almost inevitably be at the top of mind under such conditions.
Real Estate as a Hedge Against 'Bad' Inflation
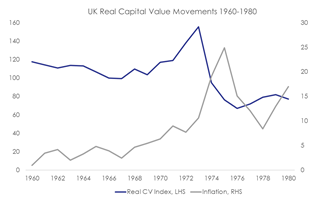
As the chart below suggests, real estate has historically done a fairly good job of hedging inflation surprises.
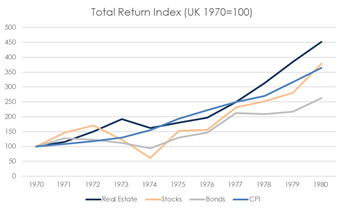
There are two primary drivers for this performance effect. The first driver is leases that almost always include some form of annual CPI indexation. The second is a glacially slow-moving and highly restrictive planning system, which when combined with a long and complex supply chain creates capacity constraints that lifts market rents. When combined, these factors come together to give landlords pricing power and hence nominal growth (that includes CPI) passes through into net operating income. Some of this earnings effect should theoretically be offset by a rise in cap rates, reflecting an increase in the discount rate that is applied to the cashflow, associated with rising interest rates. However, as this chart shows this cap rate effect has not been that significant in prior inflation 'outbreaks'.
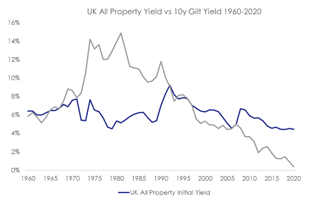
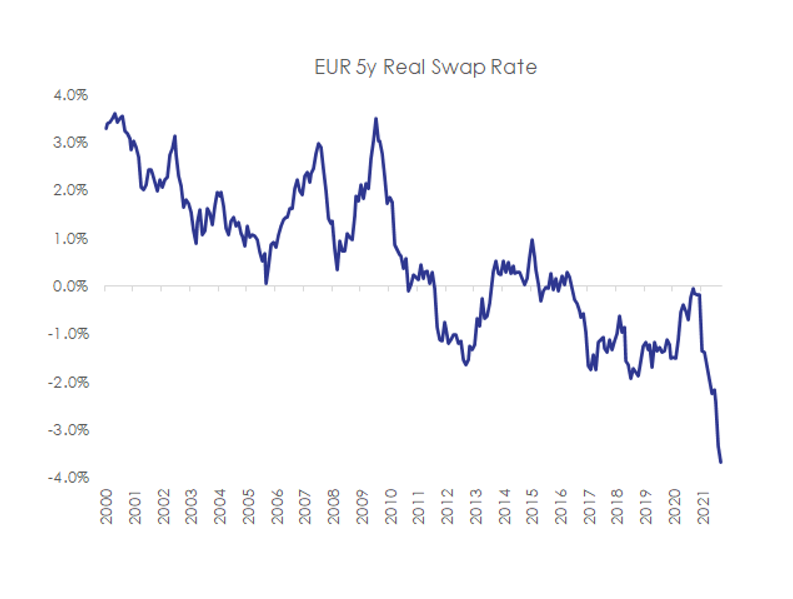
This is largely explained by capital flows. Broadly speaking, the capital that rotates out of other asset classes into the real estate sector in search of the NOI hedge has held down cap rates and worked to offset interest rate shift (creating a so-called ‘reverse-yield gap’ in the 1970's or 1980's). Given the inflation dynamics we are currently presented with, it seems unlikely that we will see the return of a 'reverse yield gap', but even so, the capital flow effects on cap rates should not be under-estimated. As the chart below shows, investors in fixed income assets are currently earning a negative real return, thus the appeal of a relatively high yielding (lower convexity) real asset that offers some level inflation hedge will be strong. Equally it is far from clear that European rates will rise significantly, particularly given the concept of 'curve control' and the scale of the public sector debt burden. The markets ability to reconcile the theory and the practice of pricing risk may well get tested in the next few years.
Where then is the reality of the inflation risk for real estate investors? With capital flowing into the sector and inflation driving nominal growth and tenant demand and as supply is inelastic in the short term, a real estate cycle becomes more probable. The chart below illustrates this nicely. When an inflation cycle builds, investors crowd into the sector in anticipation, pushing up values ahead of rising NOI. This both diminishes any risk premium on offer in the sector and increases the risk of speculation. In the 1970s the flows into the sector in the face of surging inflation risk fed a cycle that culminated in a speculative development boom. History tells us that building booms (particularly when the involve reflexive capital flows that involve bank financing) almost always undermine themselves, values and rents. The risk for investors is that the wider response to inflation may fuel a cycle and that cycles have the potential to undermine the hedge.
How to Position for Inflation Risk?
The current debate about inflation risk appears to be occurring early in the cycle, in an environment where supply is constrained and with limited evidence of 1970s style spikes in inflation volatility. This affords an inflation sensitive investor some cyclical comfort and also some time to think about what they can do now to prepare for any future risk. In our view there are a range of options to consider across varying 'risk styles. These are illustrated in this stylised inflation model below:
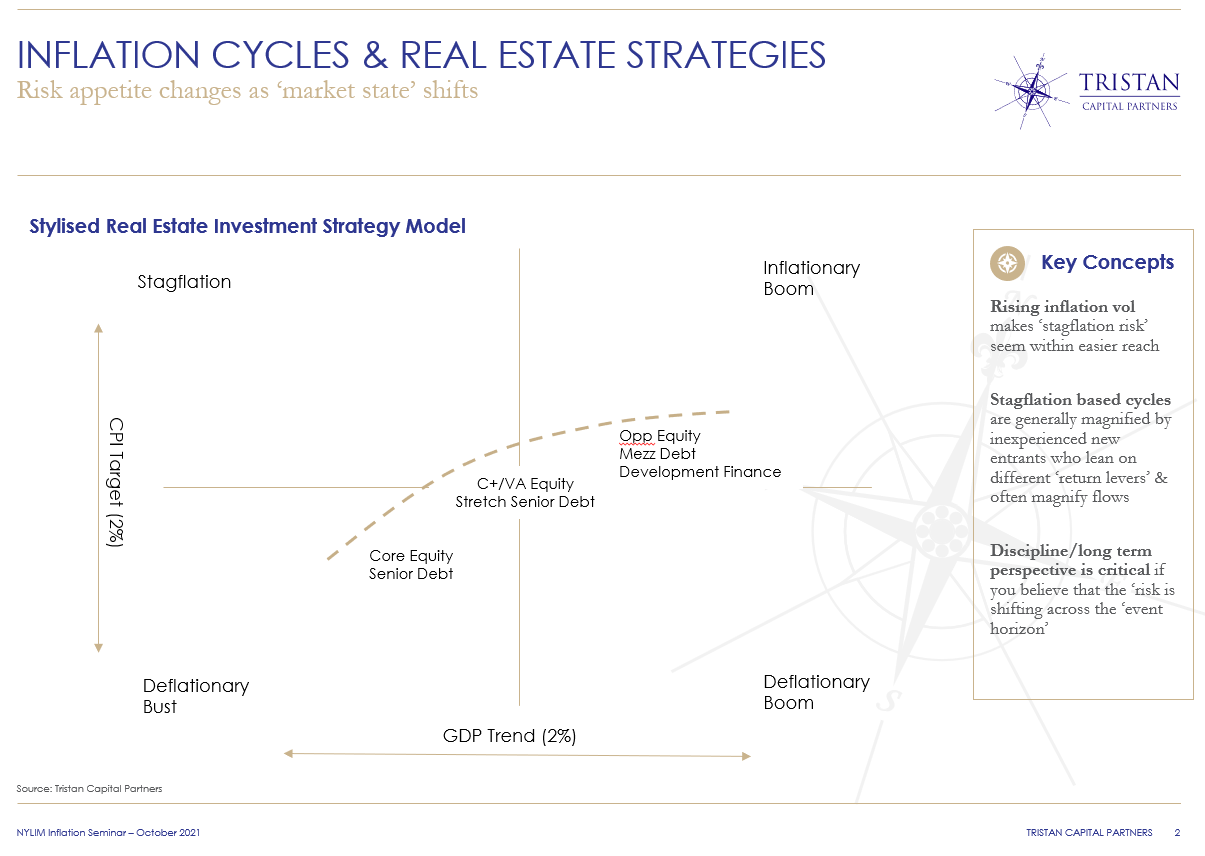
Ultimately, the adjustments required to allocation and strategy really depend on the underlying economics, cyclical dynamics and the levels of inflation that you are seeking to protect against. Right now the cyclical and economic dynamics are supportive, so most of the focus will likely be on your view of inflation risk.
On this basis, if you are in the ‘persistent’ CPI camp then you would up allocation and most likely rotate your equity and debt strategies to accommodate more operating and financial leverage. Some would also tweak the balance between the debt and equity buckets, particularly if the inflation persists and trends beyond our 'magic' 4% threshold. Conversely, if you are in the ‘transitory’ camp but felt you needed some insurance against the remote risk of a bad inflation surprise, you might add to your allocation and keep an open mind about financial and operating leverage across all strategies. If you are in the ‘70’s stagflation’ camp, then you should rotate to equity, lever up and then keep a very watchful eye on the cycle and its effects on the supply of credit and the number of cranes.
IMHO the key to making real estate work for you as an inflation hedge right now is as follows:
1 - Decide type of inflation you think is most likely and think about the risk of being wrong.
2 - If you decide to change allocations/style, then be an early bird.
3 - Never forget that real estate is inherently pro-cyclical.